Producer Prices Post Biggest Yearly Gain Since 2022
The Producer Price Index rose 0.3% in October and 6.5% over 12 months, as Boston Fed President Susan Collins said fighting inflation takes priority over housing costs.
By Erick Tarray · · 2 min read
Inflation at the wholesale level is running hotter than at any point in four years. The Producer Price Index for final demand rose 0.3% in October and 6.5% over 12 months, according to the Bureau of Labor Statistics [1].
That annual gain is the largest since prices climbed 7.4% in November 2022 [1]. The same day, Boston Fed President Susan Collins used a speech about housing to signal that tighter policy may be needed [2].
Inside the report
- Final demand goods rose 0.5% in October and are up 10.2% over 12 months, the BLS said [1].
- Services prices edged up 0.2%, the fifth monthly rise in a row [1].
- Truck freight prices climbed 3.9% in October and drove over 80% of the services increase [1].
- Excluding food, energy and trade services, prices rose 0.5% in the month and 4.9% from a year ago [1].
But October was calmer than September, when the index jumped 1.4% in a single month [1]. Collins also argued the pain is short term: "stable prices create predictable economic conditions that are good for housing," she said, according to Bloomberg [2].
Markets are not betting on patience. Bloomberg reports that federal funds futures point to hikes in December and January, with a third expected by March or April [2].
What it means for you
Floating-rate debt feels a hike first. The prime rate sits at 7%, according to the Federal Reserve [3]. By our math, each quarter-point rise in prime adds about $21 a month in interest on a $100,000 home equity line or construction draw tied to it. Fixed-rate buyers are exposed too: the 10-year Treasury, which mortgage rates tend to follow, was at 5.15% on November 13, per the Treasury [3].
Zoom out
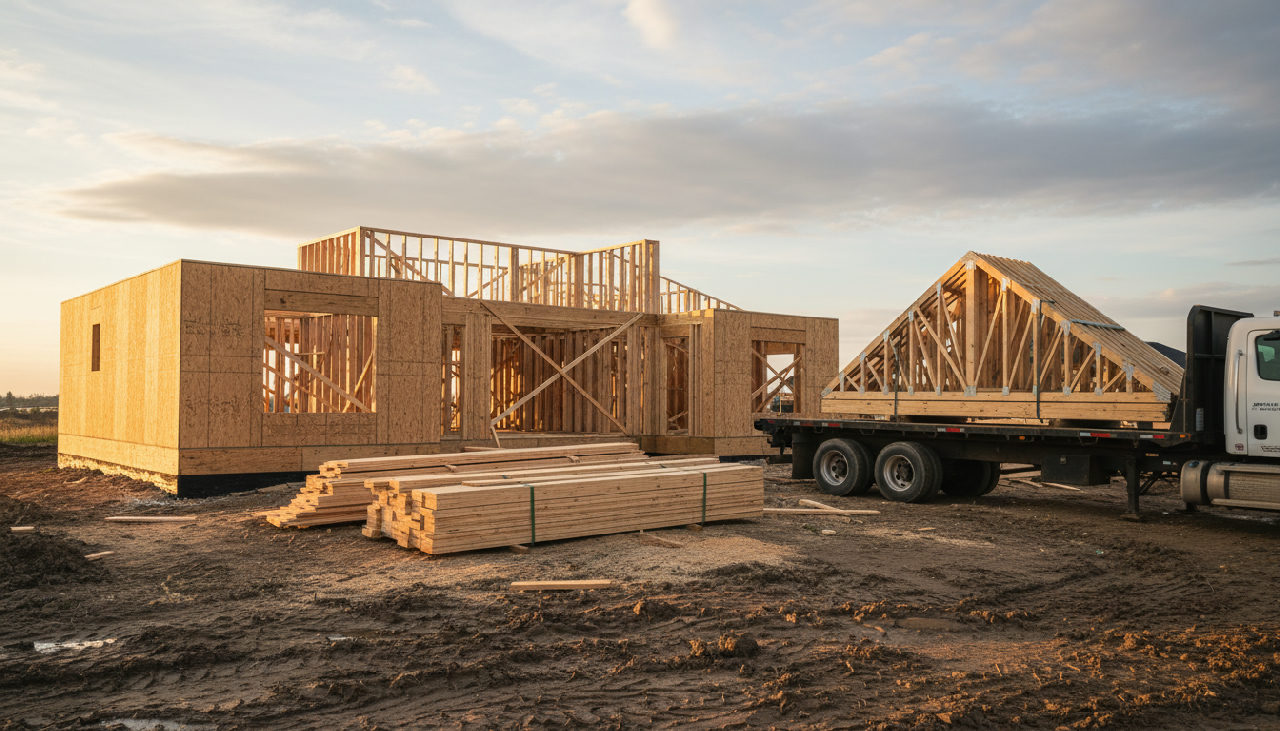
Collins said higher rates can make homes more expensive to buy and to build in the near run [2]. With goods prices up 10.2% in a year, builders face rising material bills and rising loan costs at the same time [1].
This is market commentary, not investment advice.
Sources
- [1]U.S. Bureau of Labor Statistics, Producer Price Indexes, October 2026, Nov 13, 2026.
- [2]Bloomberg via Yahoo Finance, Fed's Collins Says Inflation Fight Outweighs Housing Woes, Nov 13, 2026.
- [3]Federal Reserve Board; U.S. Treasury, H.15 Selected Interest Rates and U.S. Treasury daily par yield curve, Nov 13, 2026.