Wealth Curve Analysis
Data-driven market timing analysis across major U.S. metropolitan areas. Our proprietary Wealth Curve methodology identifies optimal entry and exit points by tracking appreciation cycles and economic indicators.
How It Works
Track Cycles
Monitor appreciation and depreciation phases across dozens of markets
Identify Signals
Use data to spot "Enter Market" and "Exit Market" indicators
Execute Strategy
Invest with market momentum, not against it
Interactive Market Dashboard
Click any market to view detailed analysis, Wealth Curve charts, and current investment status. Filter by market signal to focus on specific opportunities.
Pacific Northwest
Northwest • Regional metro
Seattle
WA • 4.0M metro
Boise
ID • 750K metro
Phoenix
AZ • 4.9M metro
San Francisco
CA • 4.7M metro
Los Angeles
CA • 13.2M metro
Sacramento
CA • 2.4M metro
Salt Lake City
UT • 1.3M metro
West Coast Market Overview
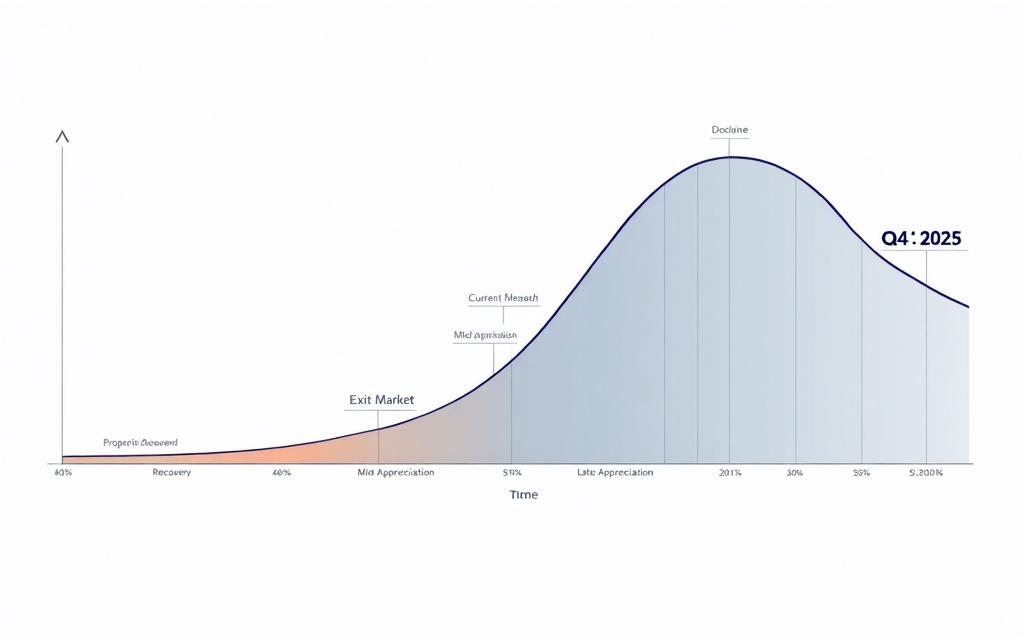
Seattle, WA
Key Indicators:
- •Price appreciation slowing
- •Affordability challenges
- •Supply increasing
Recommendation:
Monitor for re-entry signals
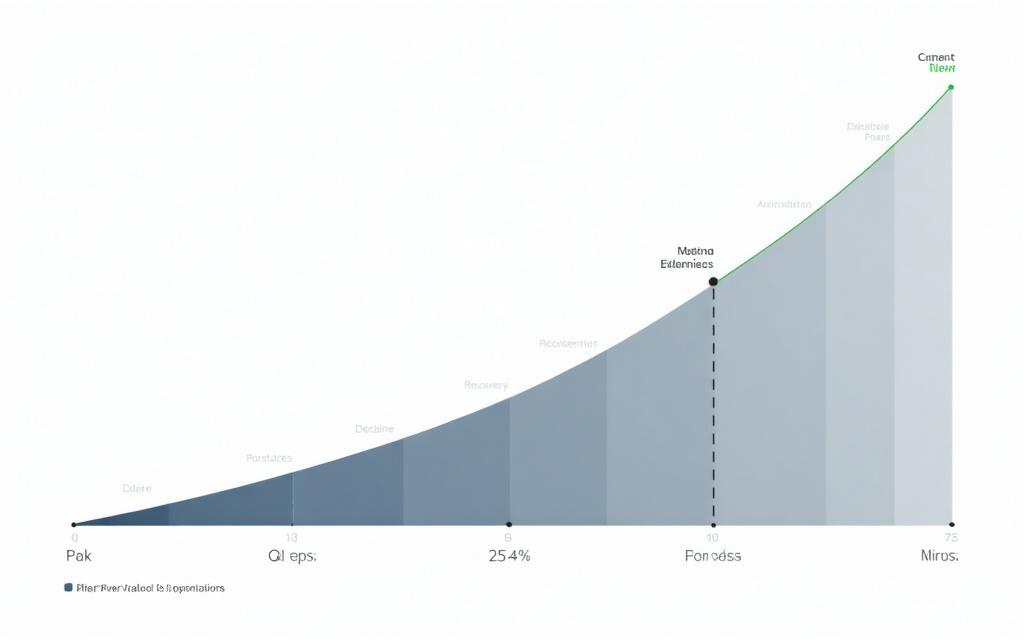
Pacific Northwest
Key Indicators:
- •Strong employment growth
- •Net positive migration
- •Supply constraints
Recommendation:
Active investment zone
The Data Behind the Curves
Our Wealth Curve analysis processes over 1,000 data points per market, including:
Economic Indicators
- • Employment growth rates
- • Major employer relocations
- • Wage growth trends
- • GDP per capita
Demographic Trends
- • Net migration patterns
- • Population growth
- • Household formation rates
- • Age demographics
Supply & Demand
- • New construction permits
- • Inventory levels
- • Days on market
- • Absorption rates
Price Metrics
- • YoY price appreciation
- • Rent-to-price ratios
- • Income-to-price ratios
- • Cap rate trends
Invest With Market Momentum
Our data-driven approach identifies optimal markets before making investment decisions, dramatically improving risk-adjusted returns.